To use in Shiny with a multi-user login, use googleAuth’s
with_shiny. See the googleAuthR
readme for details on general Google authentication with Shiny.
A video tutorial on how to create a Shiny app with googleAnalyticsR is available below. The first 20 mins creates a basic Shiny app fetching data, the last 20 mins go into combining with other libraries and using custom HTML templates:
## in server.R
library(googleAuthR)
library(googleAnalyticsR)
library(shiny)

shinyServer(function(input, output, session){

  ## Get auth code from return URL
  access_token  <- callModule(googleAuth, "auth1")

  gadata <- reactive({

    with_shiny(google_analytics_3,
               id = "222222", ## replace with your View ID
               start="2015-08-01", end="2015-08-02",
               metrics = c("sessions", "bounceRate"),
               dimensions = c("source", "medium"),
               shiny_access_token = access_token())
  })

  output$something <- renderPlot({

    ## only trigger once authenticated
    req(access_token())

    gadata <- gadata()

    plot(gadata)

  })

})

## ui.R
library(googleAuthR)
library(shiny)

shinyUI(fluidPage(

  googleAuthUI("auth1"),
  plotOutput("something")

))
To aid with creating Shiny apps using this package, some Shiny modules are available.
Authentication modules
authDropdown and authDropdownUI create a
row of selects to help with choosing a GA View.

Make sure to authenticate with at least
https://www.googleapis.com/auth/analytics.edit scopes since
this is needed for listing GA accounts.
This is useful in combination with googleAuthR’s
googleAuth module that helps with user login:
## ui.R
googleAuthUI("login"),
authDropdownUI("auth_menu")
## server.R

(...)

token <- callModule(googleAuth, "login")

ga_accounts <- reactive({
  validate(
    need(token(), "Authenticate")
  )

  with_shiny(ga_account_list, shiny_access_token = token())

  })

selected_id <- callModule(authDropdown, "auth_menu", ga.table = ga_accounts)

(...)
Google Analytics 4 Account Picker
GA4 has different data model and account structure, so it has its own
account picker module at accountPicker() - this also uses
the more modern Shiny module style. GA4 only has accounts and web
propertyId, not viewIds.
A minimal example on how to use it is shown below:
library(shiny)
library(googleAnalyticsR) # for accountPicker
library(googleAuthR)      # for gar_shiny_ui

ui <- fluidPage(title = "Shiny App",
                accountPickerUI("auth_menu", inColumns = TRUE))
server <- function(input, output, session){
  token <- gar_shiny_auth(session)

  accs <- reactive({
    req(token)
    ga_account_list("ga4")
  })

  # module for authentication
  property_id <- accountPicker("auth_menu", ga_table = accs, id_only = TRUE)
}

shinyApp(gar_shiny_ui(ui, login_ui = silent_auth), server)
Parameter selects
Universal Analytics
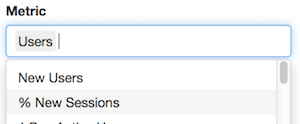
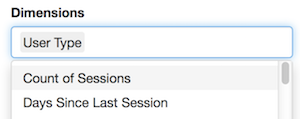
multiSelect and multiSelectUI create select
dropdowns with the GA API parameters filled in, taken from the meta
API.

 ###
GA4
Google Analytics 4 allows you to download your custom events, so
needs a new metric/dimension field picker, available as
metricDimensionSelect()
To use custom fields, you need to pass in meta data from
ga_meta("data") with your propertyId.
An example of its use with and without custom fields is shown below:
library(shiny)
library(googleAuthR)
library(googleAnalyticsR)

gar_set_client(
  web_json = "/Users/mark/dev/auth/mark-edmondson-gde-web-client.json",
  scopes = "https://www.googleapis.com/auth/analytics.readonly")

# loads a pre-existing model
model <- ga_model_load(
  "/Users/mark/dev/R/_packages/googleAnalyticsR/inst/models/ga4-trend.gamr")

modelUi <- model$shiny_module$ui
modelServer <- model$shiny_module$server

## ui.R
ui <- fluidPage(
  title = "GA4 Shiny",
  h1("GA4 Shiny App"),
  accountPickerUI("auth_menu", inColumns = TRUE),
  h2("Pick metrics and dimensions"),
  metricDimensionSelectUI("mets1"),
  metricDimensionSelectUI("dims_custom", "Dimensions"),
  h2("Model results"),
  modelUi("model1")
)

## server.R
server <- function(input, output, session){

  token <- gar_shiny_auth(session)

  ga_accounts <- reactive({
    req(token)
    ga_account_list("ga4")
  })

  property_id <- accountPicker("auth_menu",
                               ga_table = ga_accounts,
                               id_only = TRUE)

  meta <- reactive({
    req(property_id())

    ga_meta("data", propertyId = property_id())
  })

  metrics <- metricDimensionSelect("mets1", default = "sessions")
  dims_custom <- metricDimensionSelect("dims_custom",
                                       field_type = "dimension",
                                       custom_meta = meta())

  # module to display model results
  modelServer("model1", view_id = property_id, metrics = metrics)

}

shinyApp(gar_shiny_ui(ui), server)
Segment helper
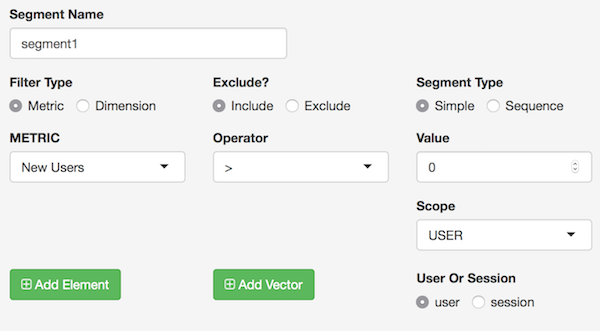
segmentBuilder and segmentBuilderUI creates
a segment builder interface. This is also available as an RStudio gadget
to help create segments more easily.

Example
An example of a Shiny app is shown below, that allows users to login in, select an account using the modules above, and then see their data via Highcharts
The code for the explorer is included below:
ui.R
## ui.R
library(googleAuthR)
library(googleAnalyticsR)
library(shiny)
library(highcharter)

shinyUI(
  fluidPage(
    googleAuthUI("login"),
    authDropdownUI("auth_menu"),
    highchartOutput("something")

  ))
server.R
## in server.R
library(googleAuthR)
library(googleAnalyticsR)
library(shiny)
library(highcharter)

function(input, output, session){

  ## Get auth code from return URL
  token <- callModule(googleAuth, "login")

  ga_accounts <- reactive({
    req(token())

    with_shiny(ga_account_list, shiny_access_token = token())

  })

  selected_id <- callModule(authDropdown, "auth_menu", ga.table = ga_accounts)

  gadata <- reactive({

    req(selected_id())
    gaid <- selected_id()
    with_shiny(google_analytics_3,
               id = gaid,
               start="2015-08-01", end="2017-08-02",
               metrics = c("sessions"),
               dimensions = c("date"),
               shiny_access_token = token())
  })

  output$something <- renderHighchart({

    ## only trigger once authenticated
    req(gadata())

    gadata <- gadata()

    ## creates a line chart using highcharts
    hchart(gadata, "line" , hcaes(x = date, y = sessions))

  })

}